Flot Charts
Flot is a pure JavaScript plotting library for jQuery, with a focus on simple usage, attractive looks and interactive features.
Chart examples
Please refer the codes below and make sure to include the all required files as mentioned in the bottom table in your web page in order to flawlessly render the charts.
<div>
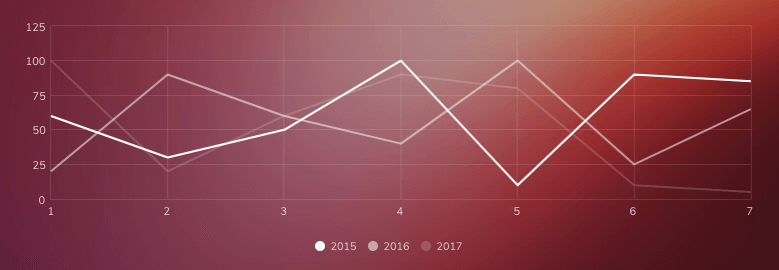
<div id="chart-line" class="flot-chart"></div>
<div class="flot-chart-legend flot-chart-legend--line"></div>
</div>// Chart Data
var lineChartData = [
{
label: '2015',
data: [[1,60], [2,30], [3,50], [4,100], [5,10], [6,90], [7,85]],
color: '#fff'
},
{
label: '2016',
data: [[1,20], [2,90], [3,60], [4,40], [5,100], [6,25], [7,65]],
color: 'rgba(255,255,255,0.5)'
},
{
label: '2017',
data: [[1,100], [2,20], [3,60], [4,90], [5,80], [6,10], [7,5]],
color: 'rgba(255,255,255,0.15)'
}
];
// Chart Options
var lineChartOptions = {
series: {
lines: {
show: true,
barWidth: 0.05,
fill: 0
}
},
shadowSize: 0.1,
grid : {
borderWidth: 1,
borderColor: 'rgba(255,255,255,0.1)',
show : true,
hoverable : true,
clickable : true
},
yaxis: {
tickColor: 'rgba(255,255,255,0.1)',
tickDecimals: 0,
font: {
lineHeight: 13,
style: 'normal',
color: 'rgba(255,255,255,0.75)',
size: 11
},
shadowSize: 0
},
xaxis: {
tickColor: 'rgba(255,255,255,0.1)',
tickDecimals: 0,
font: {
lineHeight: 13,
style: 'normal',
color: 'rgba(255,255,255,0.75)',
size: 11
},
shadowSize: 0
},
legend:{
container: '.flot-chart-legends--line',
backgroundOpacity: 0.5,
noColumns: 0,
lineWidth: 0,
labelBoxBorderColor: 'rgba(255,255,255,0)'
}
};
// Create chart
if ($('.flot-line')[0]) {
$.plot($('.flot-line'), lineChartData, lineChartOptions);
}Files required:
| Type | Files |
|---|---|
| Custom SCSS | /src/scss/inc/vendor-overrides/_flot.scss |
| Javascript | /src/js/vendors/flot-charts/line.js |
| Library |
/resources/vendors/flot/jquery.flot.js
/resources/vendors/flot/jquery.flot.resize.js
|
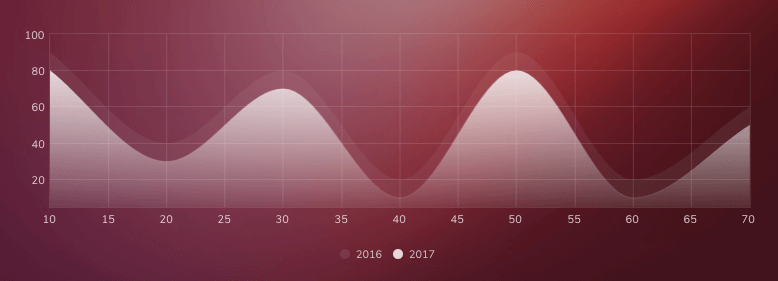
<div class="flot-chart flot-curved-line"></div>
<div class="flot-chart-legends flot-chart-legends--curved"></div>
// Chart Data
var curvedLineChartData = [
{
label: '2016',
color: 'rgba(255,255,255,0.08)',
lines: {
show: true,
lineWidth: 0,
fill: 1,
fillColor: 'rgba(255,255,255,0.05)'
},
data: [[10, 90], [20, 40], [30, 80], [40, 20], [50, 90], [60, 20], [70, 60]],
},
{
label: '2017',
color: 'rgba(255,255,255,0.8)',
lines: {
show: true,
lineWidth: 0.1,
fill: 1,
fillColor: {
colors: ['rgba(255,255,255,0.03)', '#fff']
}
},
data: [[10, 80], [20, 30], [30, 70], [40, 10], [50, 80], [60, 10], [70, 50]]
}
];
// Chart Options
var curvedLineChartOptions = {
series: {
shadowSize: 0,
curvedLines: {
apply: true,
active: true,
monotonicFit: true
},
points: {
show: false
}
},
grid: {
borderWidth: 1,
borderColor: 'rgba(255,255,255,0.1)',
show: true,
hoverable: true,
clickable: true
},
xaxis: {
tickColor: 'rgba(255,255,255,0.1)',
tickDecimals: 0,
font: {
lineHeight: 13,
style: 'normal',
color: 'rgba(255,255,255,0.75)',
size: 11
}
},
yaxis: {
tickColor: 'rgba(255,255,255,0.1)',
font: {
lineHeight: 13,
style: 'normal',
color: 'rgba(255,255,255,0.75)',
size: 11
},
min: +5
},
legend:{
container: '.flot-chart-legends--curved',
backgroundOpacity: 0.5,
noColumns: 0,
lineWidth: 0,
labelBoxBorderColor: 'rgba(255,255,255,0)'
}
};
// Create chart
if ($('.flot-curved-line')[0]) {
$.plot($('.flot-curved-line'), curvedLineChartData, curvedLineChartOptions);
}Files required:
| Type | Files |
|---|---|
| Custom SCSS | /src/scss/inc/vendor-overrides/_flot.scss |
| Javascript | /src/js/vendors/flot-charts/curved-line.js |
| Library |
/resources/vendors/flot/jquery.flot.js
/resources/vendors/flot/flot.curvedlines/curvedLines.js
/resources/vendors/flot/jquery.flot.resize.js
|
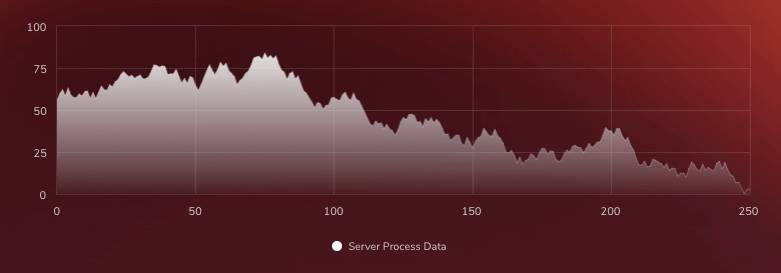
<div class="flot-chart flot-dynamic"></div>
<div class="flot-chart-legends flot-chart-legends--dynamic"></div>
// Chart Data
var data = [];
var totalPoints = 300;
function dynamicChartData() {
if (data.length > 0)
data = data.slice(1);
while (data.length < totalPoints) {
var prev = data.length > 0 ? data[data.length - 1] : 50,
y = prev + Math.random() * 10 - 5;
if (y < 0) {
y = 0;
} else if (y > 90) {
y = 90;
}
data.push(y);
}
var res = [];
for (var i = 0; i < data.length; ++i) {
res.push([i, data[i]])
}
return res;
}
// Chart Options
var dynamicChartOptions = {
series: {
label: "Server Process Data",
lines: {
show: true,
lineWidth: 0.2,
fill: 1,
fillColor: {
colors: ['rgba(255,255,255,0.03)', '#fff']
}
},
color: '#fff',
shadowSize: 0
},
yaxis: {
min: 0,
max: 100,
tickColor: 'rgba(255,255,255,0.1)',
font: {
lineHeight: 13,
style: 'normal',
color: 'rgba(255,255,255,0.75)',
size: 11
},
shadowSize: 0
},
xaxis: {
tickColor: 'rgba(255,255,255,0.1)',
show: true,
font: {
lineHeight: 13,
style: 'normal',
color: 'rgba(255,255,255,0.75)',
size: 11
},
shadowSize: 0,
min: 0,
max: 250
},
grid: {
borderWidth: 1,
borderColor: 'rgba(255,255,255,0.1)',
labelMargin:10,
hoverable: true,
clickable: true,
mouseActiveRadius:6
},
legend:{
container: '.flot-chart-legends--dynamic',
backgroundOpacity: 0.5,
noColumns: 0,
lineWidth: 0,
labelBoxBorderColor: 'rgba(255,255,255,0)'
}
};
// Create Chart
if ($('.flot-dynamic')[0]) {
var plot = $.plot('.flot-dynamic', [ dynamicChartData() ], dynamicChartOptions);
}
// Update function
var updateInterval = 30;
function chartUpdate() {
plot.setData([dynamicChartData()]);
// Since the axes don't change, we don't need to call plot.setupGrid()
plot.draw();
setTimeout(chartUpdate, updateInterval);
}
chartUpdate();Files required:
| Type | Files |
|---|---|
| Custom SCSS | /src/scss/inc/vendor-overrides/_flot.scss |
| Javascript | /src/js/vendors/flot-charts/dynamic.js |
| Library |
/resources/vendors/flot/jquery.flot.js
/resources/vendors/flot/jquery.flot.resize.js
|
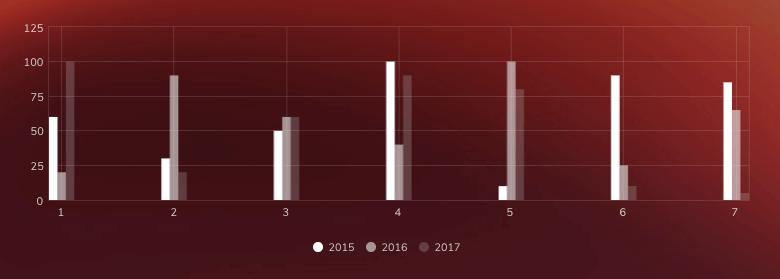
<div>
    <div id="chart-bar" class="flot-chart"></div>
    <div class="flot-chart-legend flot-chart-legend--bar"></div>
</div>
// Chart Data
var barChartData = [
{
label: '2015',
data: [[1,60], [2,30], [3,50], [4,100], [5,10], [6,90], [7,85]],
bars: {
order: 0,
fillColor: '#fff'
},
color: '#fff'
},
{
label: '2016',
data: [[1,20], [2,90], [3,60], [4,40], [5,100], [6,25], [7,65]],
bars: {
order: 1,
fillColor: 'rgba(255,255,255,0.5)'
},
color: 'rgba(255,255,255,0.5)'
},
{
label: '2017',
data: [[1,100], [2,20], [3,60], [4,90], [5,80], [6,10], [7,5]],
bars: {
order: 2,
fillColor: 'rgba(255,255,255,0.15)'
},
color: 'rgba(255,255,255,0.15)'
}
];
// Chart Options
var barChartOptions = {
series: {
bars: {
show: true,
barWidth: 0.075,
fill: 1,
lineWidth: 0
}
},
grid : {
borderWidth: 1,
borderColor: 'rgba(255,255,255,0.1)',
show : true,
hoverable : true,
clickable : true
},
yaxis: {
tickColor: 'rgba(255,255,255,0.1)',
tickDecimals: 0,
font: {
lineHeight: 13,
style: 'normal',
color: 'rgba(255,255,255,0.75)',
size: 11
},
shadowSize: 0
},
xaxis: {
tickColor: 'rgba(255,255,255,0.1)',
tickDecimals: 0,
font: {
lineHeight: 13,
style: 'normal',
color: 'rgba(255,255,255,0.75)',
size: 11
},
shadowSize: 0
},
legend:{
container: '.flot-chart-legends--bar',
backgroundOpacity: 0.5,
noColumns: 0,
lineWidth: 0,
labelBoxBorderColor: 'rgba(255,255,255,0)'
}
};
// Create chart
if ($('.flot-bar')[0]) {
$.plot($('.flot-bar'), barChartData, barChartOptions);
}Files required:
| Type | Files |
|---|---|
| Custom SCSS | /src/scss/inc/vendor-overrides/_flot.scss |
| Javascript | /src/js/vendors/flot-charts/bar.js |
| Library |
/resources/vendors/flot/jquery.flot.js
/resources/vendors/flot/flot.orderbars/jquery.flot.orderBars.js
/resources/vendors/flot/jquery.flot.resize.js
|
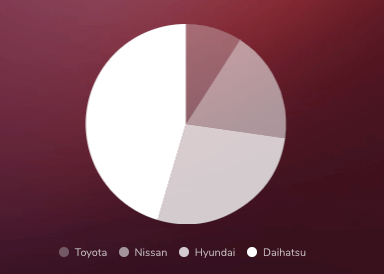
<div class="flot-chart flot-pie"></div>
<div class="flot-chart-legends flot-chart-legend--pie"></div>
// Make some sample data
var pieData = [
{data: 1, color: 'rgba(255,255,255,0.25)', label: 'Toyota'},
{data: 2, color: 'rgba(255,255,255,0.5)', label: 'Nissan'},
{data: 3, color: 'rgba(255,255,255,0.75)', label: 'Hyundai'},
{data: 5, color: '#fff', label: 'Daihatsu'}
];
// Pie Chart
if($('.flot-pie')[0]){
$.plot('.flot-pie', pieData, {
series: {
pie: {
show: true,
stroke: {
width: 0
}
}
},
legend: {
container: '.flot-chart-legend--pie',
noColumns: 0,
lineWidth: 0,
labelBoxBorderColor: 'rgba(255,255,255,0)'
}
});
}Files required:
| Type | Files |
|---|---|
| Custom SCSS | /src/scss/inc/vendor-overrides/_flot.scss |
| Javascript | /src/js/vendors/flot-charts/pie.js |
| Library |
/resources/vendors/flot/jquery.flot.js
/resources/vendors/flot/jquery.flot.pie.js
/resources/vendors/flot/jquery.flot.resize.js
|
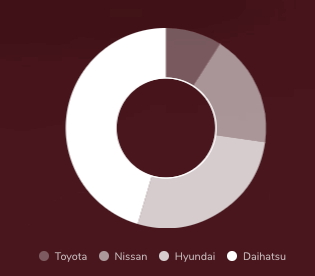
<div class="flot-chart flot-donut"></div>
 <div class="flot-chart-legends flot-chart-legend--donut"></div>
if($('.flot-donut')[0]){
$.plot('.flot-donut', pieData, {
series: {
pie: {
innerRadius: 0.5,
show: true,
stroke: {
width: 0
}
}
},
legend: {
container: '.flot-chart-legend--donut',
noColumns: 0,
lineWidth: 0,
labelBoxBorderColor: 'rgba(255,255,255,0)'
}
});
}Files required:
| Type | Files |
|---|---|
| Custom SCSS | /src/scss/inc/vendor-overrides/_flot.scss |
| Javascript | /src/js/vendors/flot-charts/pie.js |
| Library |
/resources/vendors/flot/jquery.flot.js
/resources/vendors/flot/jquery.flot.pie.js
/resources/vendors/flot/jquery.flot.resize.js
|
Chart Tooltips
Make sure to include the following function (once) in order to enable tooltips on the chart data.
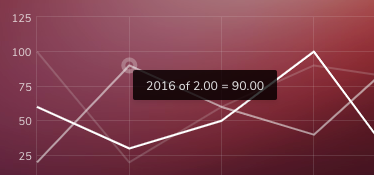
// Tooltips for Flot Charts
if ($('.flot-chart')[0]) {
    $('.flot-chart').bind('plothover', function (event, pos, item) {
        if (item) {
            var x = item.datapoint[0].toFixed(2),
                y = item.datapoint[1].toFixed(2);
            $('.flot-tooltip').html(item.series.label + ' of ' + x + ' = ' + y).css({top: item.pageY+5, left: item.pageX+5}).show();
        }
        else {
            $('.flot-tooltip').hide();
        }
    });

    $('<div class="flot-tooltip"></div>').appendTo('body');
}